One Practice. Six Years. Every KPI Green. Here’s What That Actually Cost.
What a 98% collection rate actually requires — and what it means if you’re trying to get there in-house.
For some practice owners, the numbers tell a clear story. Production is up, the schedule is full, the team is moving — and at the end of the month, the deposit reflects it.
For others, there’s something quieter going on. A sense that the production and the deposit don’t quite match the way they should. Not a crisis, maybe not even something you could point to on a report — just a feeling that something in the middle isn’t working the way you’d expect it to.
Your team may be doing everything that looks right. Phones answered, patients checked in, the day running the way a day is supposed to run. And still, if you’ve ever found yourself wondering why a claim hasn’t been followed up on, or how a patient balance got to 90 days, you may have gotten some version of the same answer:
“I’m busy. I’m by myself.”
And they may not be wrong. That might be exactly the problem.
Some of the practices we’ve worked with describe collections that slipped from the mid-90s to the 60s and 70s after a key person left — and no one noticed until the doctor started pulling accounts himself. Others talk about patients who felt rushed, missed phone calls, a team stretched too thin between the people in front of them and the work waiting on a screen. Some had tried other billing companies. Some had tried dividing the work among the team. Some had just been doing their best and quietly watching it not be enough.
What they had in common was a revenue cycle that didn’t have anyone’s full attention. Not because anyone was failing — but because it’s nearly impossible to give something your full attention when 95% of your day is already spoken for by the people standing right in front of you.
This post is about what it looks like when that changes.
First, Let’s Talk About What’s Actually Being Measured
Before we get into results, it’s worth establishing what we’re actually reporting — because not all billing companies report the same way. In fact, when I was working as a subcontractor for another billing company early in my career, there was exactly one KPI reported to clients every month: collection rate. That’s it. One number.
Collection rate is important. But on its own, it is also one of the most incomplete pictures a practice can be handed. Understanding why requires knowing what it actually measures — and what it quietly leaves out.
Here are the five benchmarks every BIC client relationship is built around:
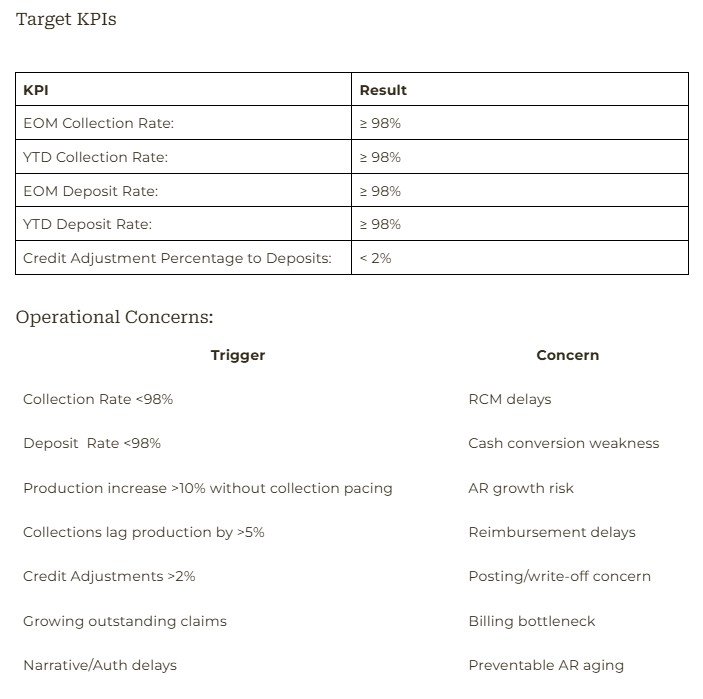
BIC Dental Revenue Operation’s KPI
These are the outcome for every contract we sign. Not aspirational targets — the floor.
Collection Rate vs. Deposit Rate: They Are Not the Same Thing
Collection rate is a balanced accounting figure. It reflects how much was credited to patient accounts in a given timeframe — which includes cash payments, yes, but also insurance adjustments, write-offs, and any other credit posted to close out a balance. A practice could report a 100% collection rate while quietly writing off patient copays, posting courtesy adjustments to aged accounts, or crediting balances in ways that close the ledger without a single dollar changing hands. The accounts are “balanced.” That doesn’t mean they were paid.
Deposit rate is different. It excludes adjustments entirely. It measures only what was actually converted to cash — real dollars, deposited. No adjustments. No write-offs. No accounting maneuvers. Just: what produced in this practice actually became money in the bank. This is the true marker for how efficiently treatment is being converted to revenue.
The gap between those two numbers is where practices may be losing money without realizing it — and without a revenue partner who reports both, it’s possible to never see it.
The Sneaky Leak: Credit Adjustment Percentage
Credit adjustments are a normal and necessary part of dental revenue cycle management. Insurance contractual adjustments, legitimate write-offs, small balance waivers — these exist in every practice. The question isn’t whether they exist. It’s whether they’re being handled correctly — and whether the data they produce can actually be trusted.
Properly and accurately allocating adjustments by reason is as important as posting the original charge. Because when adjustments are generically coded or misclassified, the reporting becomes unreliable — and unreliable data makes it nearly impossible to know where your revenue is actually going.
Insurance contractual adjustments belong in their own category and should never be posted to collections. Bad debt write-offs don’t belong in production. And then there is the adjustment code that gives every experienced revenue cycle person pause: the generic “write-off” or “credit adjustment” with no further detail. When that code appears with any regularity on a report, the honest answer to what it means is: we don’t know. And that’s the problem.
Our benchmark is under 2% of total deposits. When that number climbs — toward 3%, 4%, higher — it almost never happens by accident. It usually means balances are being adjusted off the books instead of collected, or that the coding is too vague to tell the difference. Either way, revenue may be disappearing in a place that’s easy to miss if no one is specifically looking for it.
We watch this number the way a fox watches a field. Patient. Precise. Nothing moves without us seeing it.
Which, if you’ve ever wondered, is exactly why the fox is BIC’s official mascot.
The Fox and the Revenue Cycle
The fox has been recognized across cultures for centuries as a symbol of intelligence, adaptability, and the kind of quiet cunning that doesn’t need to announce itself. It thrives in wildly different environments — dense forests, open fields, urban centers — because it doesn’t rely on size or force. It relies on awareness. Keen observation. The ability to read a situation, find the gap others missed, and move with precision when the moment is right.
Those are the qualities we try to bring to every revenue cycle we manage.
Revenue cycle work rewards the same instincts. It requires adaptability — because no two payers behave the same way, no two practices have the same breakdowns, and the rules change often enough that rigidity is a liability. It requires resilience — because clean claims get denied, patterns take time to surface, and the work doesn’t stop when something doesn’t go the way it should. And it requires genuine problem-solving — not just processing, but thinking. Understanding why something keeps happening and knowing what to do about it.
The fox doesn’t need to be the loudest or the largest. It just needs to be the most aware. That’s the standard we hold ourselves to — and it’s why, when you see our logo, you’ll always see the fox.
What Six Years Looks Like
One of our practices closed May with every single KPI at or above benchmark. They’re a $3.5 million practice. We’ve been their revenue operations partner for six years.
Here’s what the report looked like:
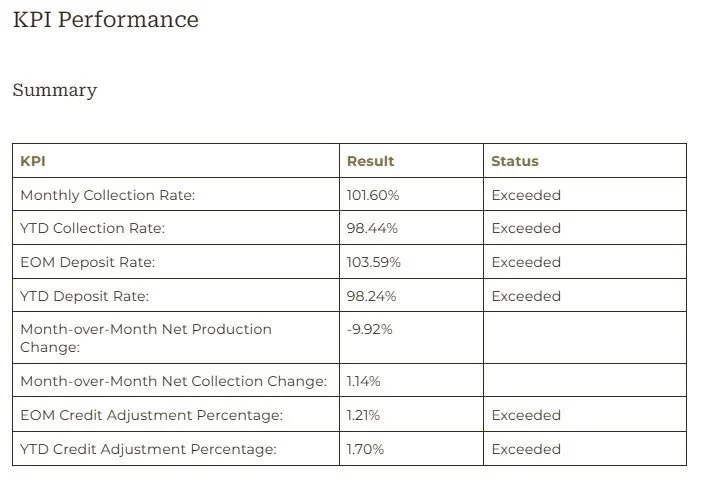
May 2026 KPI Performance Summary for a BIC client.
This practice is on pace to produce $3,669,534 this year. With the revenue system we’ve built and maintained together, they can reasonably expect $3,604,950 to actually land in the bank.
That’s not a favorable payer mix. That’s not luck. That’s a system that has been built, refined, and protected — month after month — for six years.
The Work Behind It
Here is what our team logged in May alone to hold those numbers:
883 appointments verified.
And that word — verified — is doing a lot of work. This isn’t simply confirming insurance is active. For every upcoming appointment, we’re checking coverage, reviewing any outstanding AR so the front desk can collect at check-in, and confirming that every operative appointment has a treatment financial on file before the patient ever arrives. Three workflows. Every patient. Every time.
569 claims submitted. 27 denied.
That’s a 95.2% clean claim rate. The 27 that came back didn’t sit. They were worked.
171 insurance follow-ups. 163 patient AR follow-ups.
334 follow-ups in a single month. This is the work that most practices intend to do — and the work that gets pushed when the day gets away from the team.
265 statements sent.
Patient balances don’t collect themselves. Every statement is a deliberate touchpoint. Without consistent follow-through, those balances age quietly until they become something much harder to recover.
37 benefit tables updated.
Fee schedules, frequency limits, special rules, payment tables for exceptions — current and accurate. This is the kind of detail that prevents a clean claim from coming back denied three weeks after the appointment. Or AR to chase after the fact.
186 new patients.
Every new patient means a new insurance file to build, verify, and understand. At this volume, it’s a significant operational load. It ran smoothly because the infrastructure was already in place to absorb it.
109 emails from the in-office team and patients.
Revenue cycle doesn’t happen in isolation. Every question answered, every discrepancy resolved, every escalation handled keeps the cycle moving forward instead of sideways.
Why This Volume Is Possible
Here’s the part that matters most — and the part that’s hardest to replicate inside a practice.
We don’t have a front desk. We don’t have patients standing in front of us. Our phones aren’t ringing with reschedule requests or new patient calls. Nobody is walking up mid-task with a question that needs an answer right now.
This is what we do. Every day. All day. Every week. Every month. The revenue cycle isn’t one item on a list of twelve — it is the list.
When a claim needs to be followed up on, it gets followed up on. Not when there’s a free moment. Not after the schedule is set and the phones slow down. It gets done because there is nothing else competing for that time and attention.
That’s not a criticism of in-house teams. A front desk employee who also handles scheduling, patient check-in, phones, and treatment plan paperwork isn’t failing at revenue cycle management. They’re doing the math of a day that has more work in it than hours. Something always gets deprioritized. It’s almost always the work that doesn’t have a person attached to it — the claim that’s sitting, the statement that hasn’t gone out, the follow-up that keeps getting pushed to tomorrow.
These teams are face-to-face with someone 95% of their day. How could they possibly fit all of this into the other 5%?
And Then There’s Week One
This week, we started with a new practice.
The doctor is frustrated. He wants clarity. He wants to understand what’s happening with his revenue — where it’s going, why the numbers feel off, what’s actually being done about it. Those are the right questions. And they’re the questions we’re built to answer.
In our first week of submitting claims, we ran into 17 rejections out of 107 submitted. Not denials — rejections. Claims that couldn’t even be processed because eligibility wasn’t verified before the patient was seen.
Fee schedules that may not have been updated in years. Copays leaving the building uncollected. Benefit tables that don’t reflect what the insurance will actually pay.
There are reasons things got here. There always are. And we’re not interested in the reasons — we’re interested in what it takes to fix it.
Because here’s what we know: this team isn’t lazy. This doctor isn’t careless. This practice got here the same way many practices get here — gradually, quietly, while everyone was busy doing the visible work in front of them. The revenue cycle work that doesn’t have a face, doesn’t make noise, and doesn’t demand attention in the moment? It slipped.
It can slip in a lot of practices. More than most owners might realize until someone starts pulling on the thread.
Why We Require a Minimum Six-Month Engagement
Results like the ones in that May report don’t happen in 90 days. We want to be direct about that, because we think you deserve honesty more than you deserve a sales pitch.
The first four weeks of any new engagement are an adjustment period — for the in-office team and for us. Every practice is unique. Even though our systems are standard, learning how they interact with your specific workflows, your software, your team’s communication style, and your payer mix takes time. We’re observing patterns, identifying where the breakdowns are happening, and beginning the work of educating the team on what we need from them and why. That foundation can’t be rushed without compromising everything built on top of it.
The patterns that matter most — the payer that consistently downgrades a specific code, the adjustment that keeps landing in the wrong bucket, the recurring gap between what’s verified and what’s collected at the front desk — take time to surface. You can’t see a pattern in four weeks. You can barely see one in eight.
We’re also honest about what we’re not willing to do: push hard for 90 days to make something look fixed, hand it back, and walk away before it’s actually stable. A quick cleanup with no long-term maintenance isn’t a solution. It’s a temporary improvement that will erode the moment the same conditions return — and without someone actively holding the cycle, they tend to.
We want long-term partners. We want to produce results that are dependable month over month, not impressive once. And we can only do that with an engagement long enough to actually build something worth keeping.
Anything less than six months wouldn’t give us — or you — a fair picture of what this work actually produces.
What It Means for Your Practice
Those two practices — six years and week one — may not be as far apart as they seem. One of them just had someone pulling on the thread for a long time.
If any part of this felt familiar — the gap you sense more than you see, the team that’s clearly working hard, the numbers that don’t quite land the way you’d expect — it might be worth taking a closer look at where your revenue is actually going.
The 5-Minute Collection Gap Assessment is a good place to start. Five minutes. A real number. And a much clearer picture of what might be sitting in the gap between what you’re producing and what you’re collecting.